Catastrophe · Monuments · Pulse
Earth & Space
Twelve thousand years ago something reset this planet. What survived got cut into impossible stone. And the ground beneath your feet has never stopped humming.
The Planet, Told Three Ways
Earth’s memory is longer than any civilisation that sits on it. A catastrophe that ended the last ice age in one human generation. Monuments cut straight out of living rock by builders we can’t fully explain. A magnetic, electric, seismic pulse that hasn’t stopped since the crust cooled. Three tracks, one story.
Part I — The Last Catastrophe
The Last Catastrophe
When the Ice Came Back
The long orbital rhythms — the Milankovitch cycles — sit on /cosmos. What happened to this planet, to these people, twelve thousand years ago, sits here.
12,900 Years Ago
The Younger Dryas — When the Ice Came Back
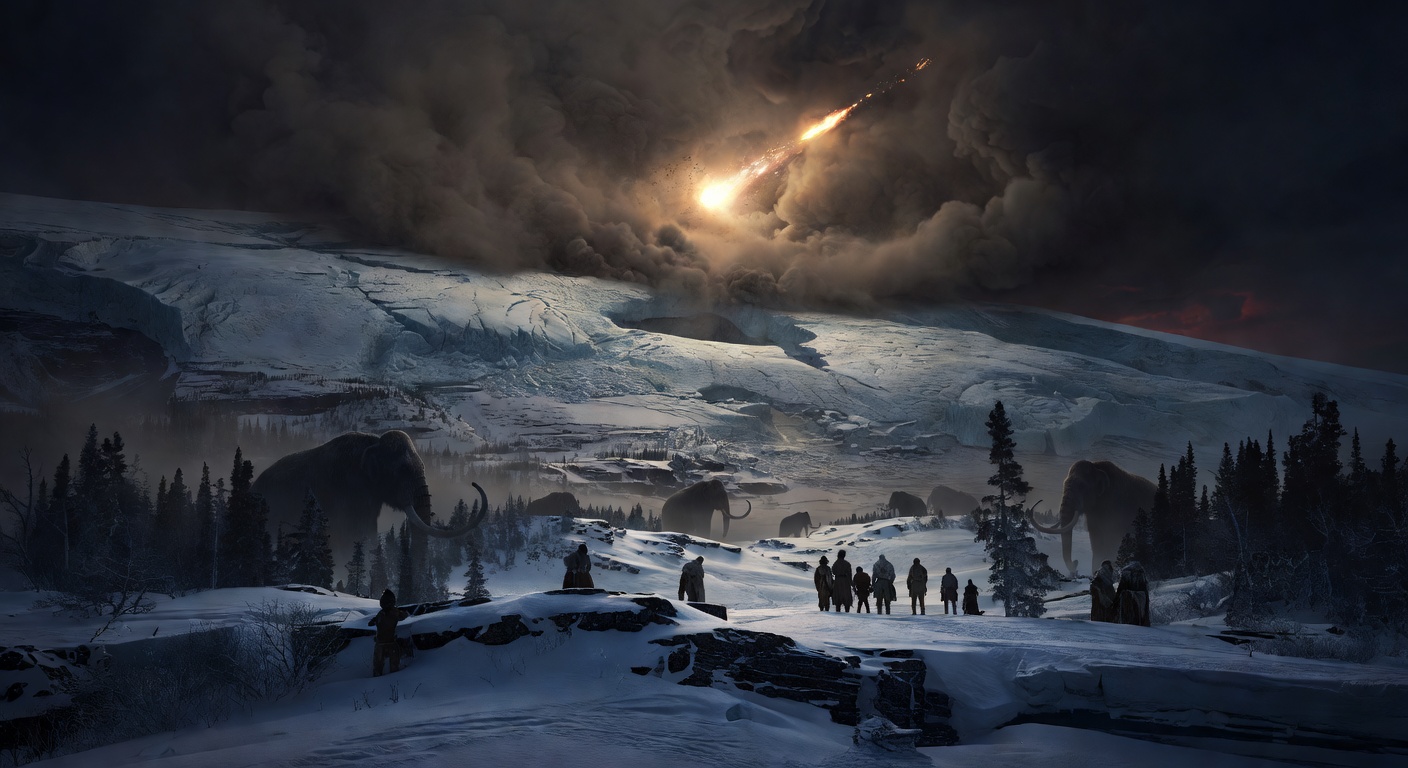
The planet had been warming for ten thousand years. Glaciers were retreating, sea levels were rising, forests were marching north. Then, about 12,900 years ago, the climate flipped back into ice-age conditions across the Northern Hemisphere in the span of a single human generation. The cold snap held for roughly 1,200 years and then ended just as fast. This is the Younger Dryas, and it is the clearest example we have of how fast Earth’s climate can change.
What triggered it is contested. The mainstream reading: meltwater from the collapsing North American ice sheet — released when glacial Lake Agassiz drained through a new outlet — flooded the North Atlantic, shut down the ocean currents that normally carry tropical heat north, and dropped the Northern Hemisphere into a short deep freeze. The chemistry of ancient shells in the seabed supports it. The mechanism is physically plausible.
The competing reading is the Younger Dryas Impact Hypothesis: a comet or asteroid broke up over North America, lit continent-scale fires, filled the atmosphere with dust, melted the ice sheet from the top down, and kicked the climate off a cliff. The evidence: a spike in iridium, tiny diamonds made by huge heat and pressure, and small glass beads from melted rock — all showing up at the same layer across more than fifty sites on multiple continents. Plus a ~31 km impact crater found under the Hiawatha Glacier in 2018 — later redated in 2022 to 58 million years old, which took the crater out of the case but left the stuff in the dirt. Neither reading is fully settled. Both would end the Ice Age fast. Only the second would also end whatever was living on the North American plains.
Plotted onto the precessional Great Year, 12,900 BP lands at the start of the Age of Leo — the Sphinx axis. See Catastrophes on the Great Year wheel for the fact-checked map of every major Pleistocene cataclysm.
The Casualties
37 Genera Gone in a Geological Instant
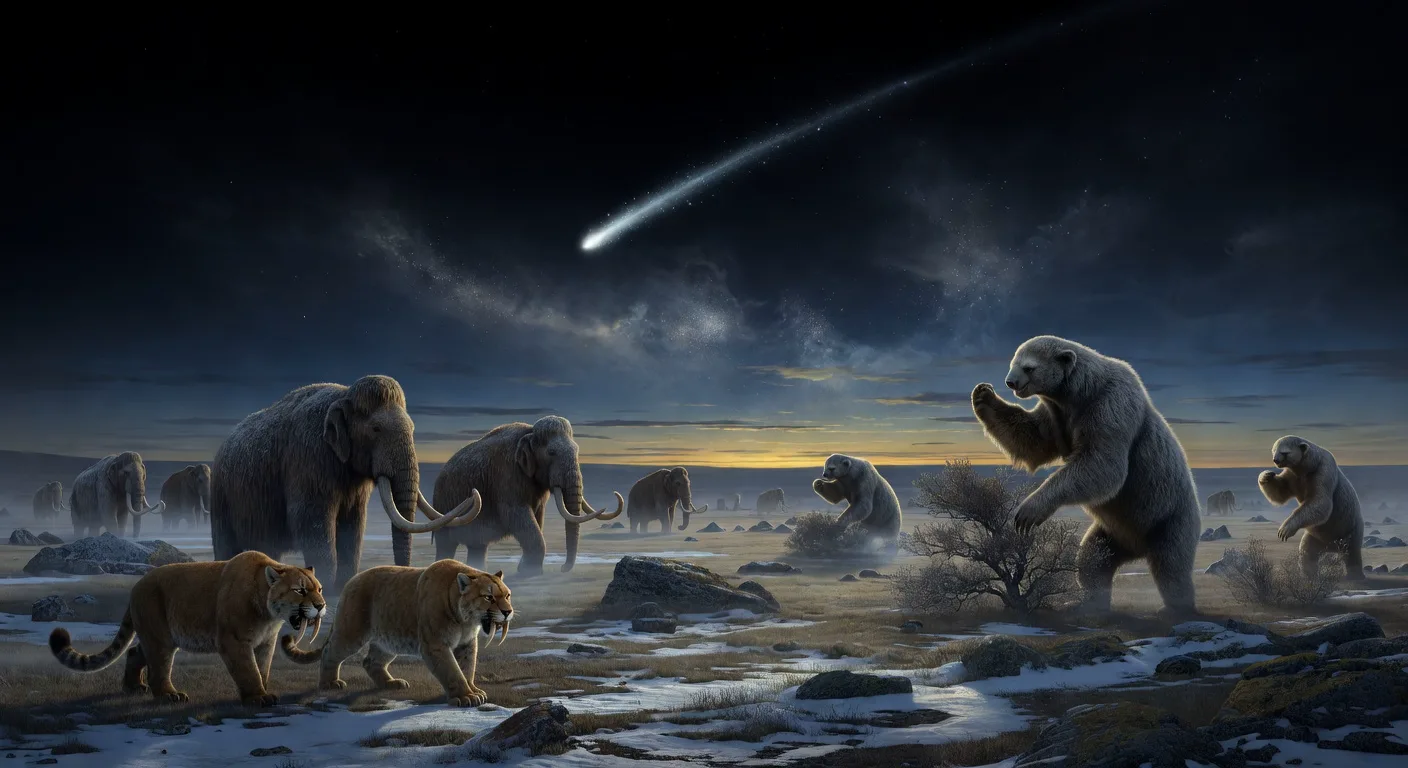
The Younger Dryas boundary coincides with the extinction of 37 genera of large mammals in the Americas alone — mammoths, mastodons, saber-toothed cats (Smilodon), giant ground sloths (Megatherium), dire wolves, American horses, American camels, short-faced bears. North America lost roughly 70% of its large animal species in a geological instant. The timing is too tight to be gradual climate adaptation.
The “overkill hypothesis” (Paul Martin, 1966) blames Clovis hunters. Problem: the Clovis population was probably under 50,000 people spread across a continent, and the killing rate the theory needs is higher than anything anthropologists have ever actually recorded anywhere. Bigger problem: many of the extinct species — giant tortoises, giant beavers — weren’t Clovis prey at all. You cannot spear a glyptodont (a car-sized armoured mammal) into extinction.
The alternative: the Younger Dryas impact killed them directly, through blast, continent-scale wildfire, and sudden climate collapse. The black mat layer — a dark, carbon-rich band found at more than fifty sites — has big-animal bones right below it and none above. Whatever happened, it happened fast enough to leave a line in the dirt you can still draw with a pencil.
See Catastrophes on the Great Year wheel for the twelve YD-pulse species with photos, dates, and the precessional clock that 12,900 BP sits on.
The Scars
500,000 Elliptical Craters, All Pointing the Same Direction
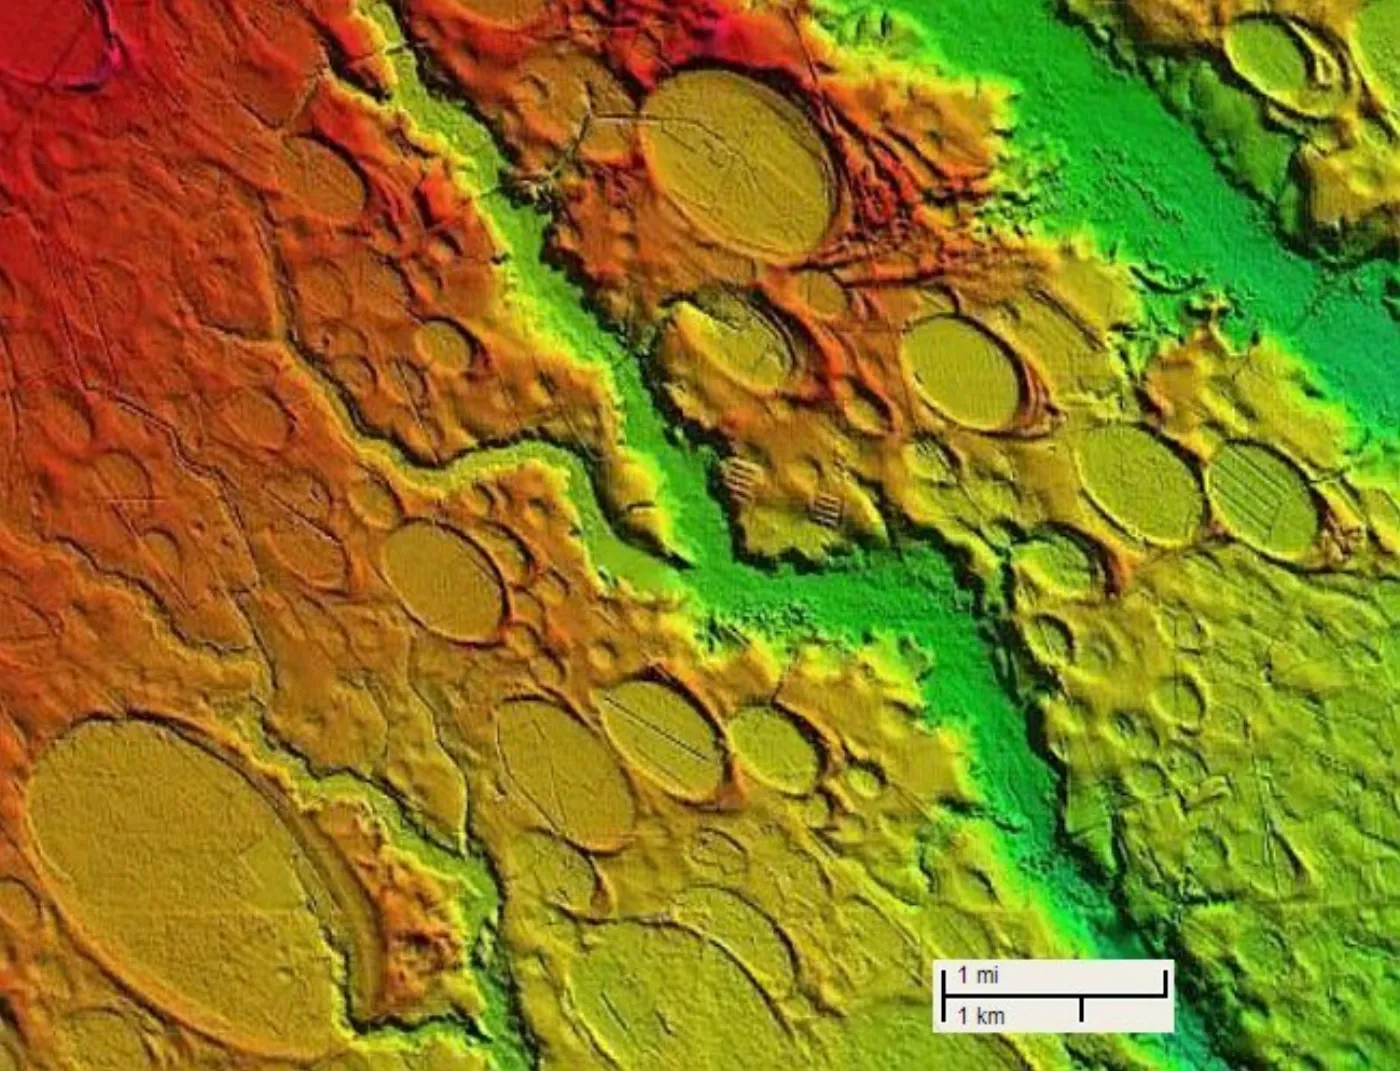
From New Jersey to Florida, roughly 500,000 elliptical depressions cover the Atlantic coastal plain — the Carolina Bays. They range from a few hundred metres to several kilometres across. Modern LiDAR — laser scans from aircraft that strip away the vegetation and show the bare ground — reveals the real picture. It is not a landscape with some oval lakes in it. It is carpet-bombed. Overlapping ellipses, packed shoulder to shoulder across a thousand kilometres of coastline, all tilted the same way.
And they all point at the same thing. Trace the long axes backwards across the map and they meet over the Saginaw Bay region of Michigan — right where the Laurentide ice sheet was at its thickest during the last glacial maximum.
The mainstream objection
Mainstream geology rejects the impact reading for one main reason: no meteorite fragments, no projectile material, no source crater. The ovals are there, but the things that supposedly made them are not. The official explanation is wind and groundwater slowly shaping relict ice-age lakes — even though no wind model has ever explained why the orientation holds to within a few degrees across 1,500 km of coastline.
The ice-projectile answer
Here is where it gets interesting. Antonio Zamora’s 2017 ballistic model says a comet or asteroid did not hit the ground in North Carolina. It hit ice — an ice sheet one to two kilometres thick, up over Saginaw Bay. The impact blasted huge chunks of that ice up into the atmosphere, which came down hundreds of kilometres to the south on ballistic arcs, hitting the coastal plain at supersonic speeds and grazing angles.
For a few minutes, the eastern seaboard of North America got carpet-bombed by half a million supersonic ice boulders. Shock waves flattened everything between them. Then the ice melted.
Which is the elegant part. The “missing meteorite material” the mainstream keeps pointing at? Water. Melted and drained. The “missing source crater”? Under the Laurentide ice sheet, which also melted. The projectiles and the entry wound are both gone because both were made of ice, and ice doesn’t stick around after the climate warms up.
If the model is right, it was not a good time to be alive in that part of the world.
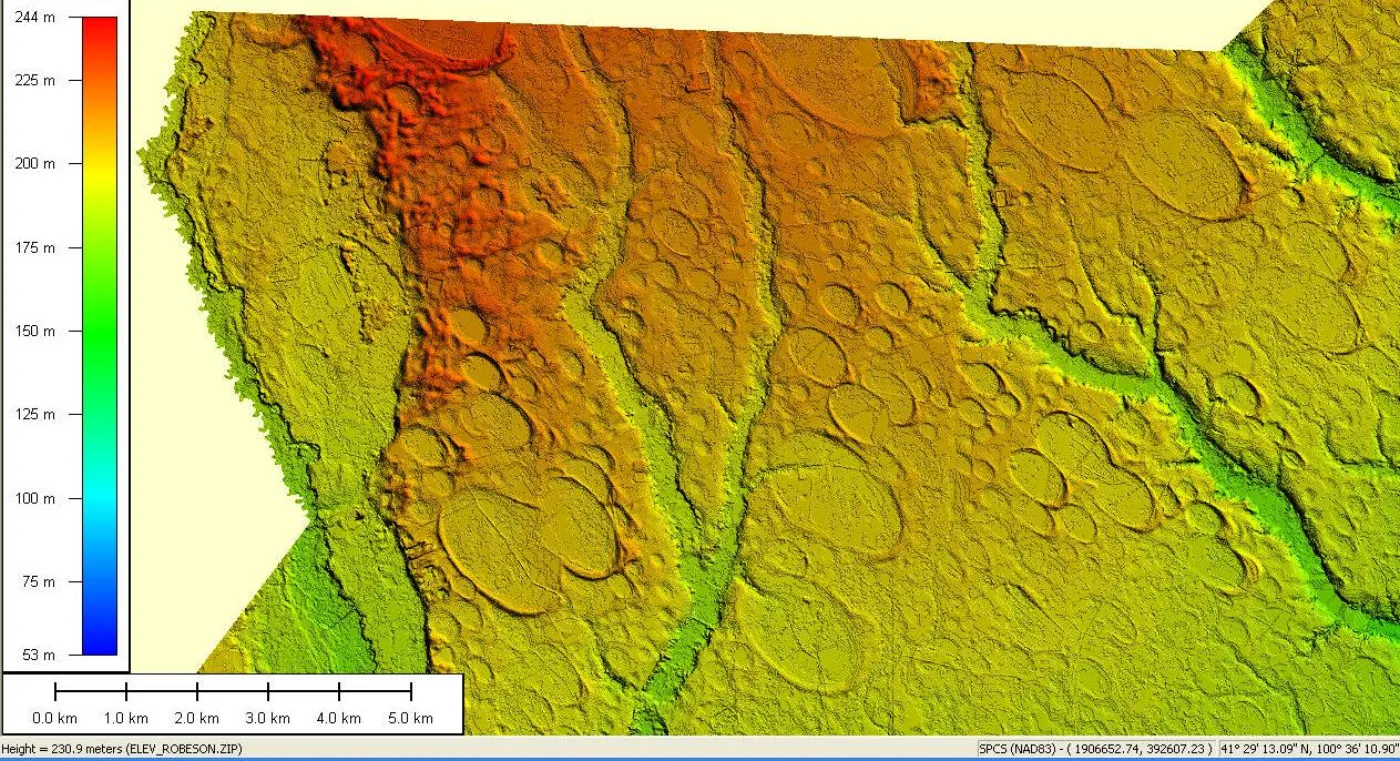
LiDAR elevation strip across the coastal plain. Each oval is a separate Bay. The pattern runs unbroken from New Jersey to Florida.
See it yourself
Don’t take our word for any of this. Open Google Earth and fly to somewhere like the North Carolina / South Carolina coastal plain. Tilt the view down, zoom in, and look around. You will see the ovals. They are everywhere. Once your eye locks onto the shape, you will not be able to stop seeing them. Farms are laid out around them. Roads curve to avoid them. Lakes sit inside them.
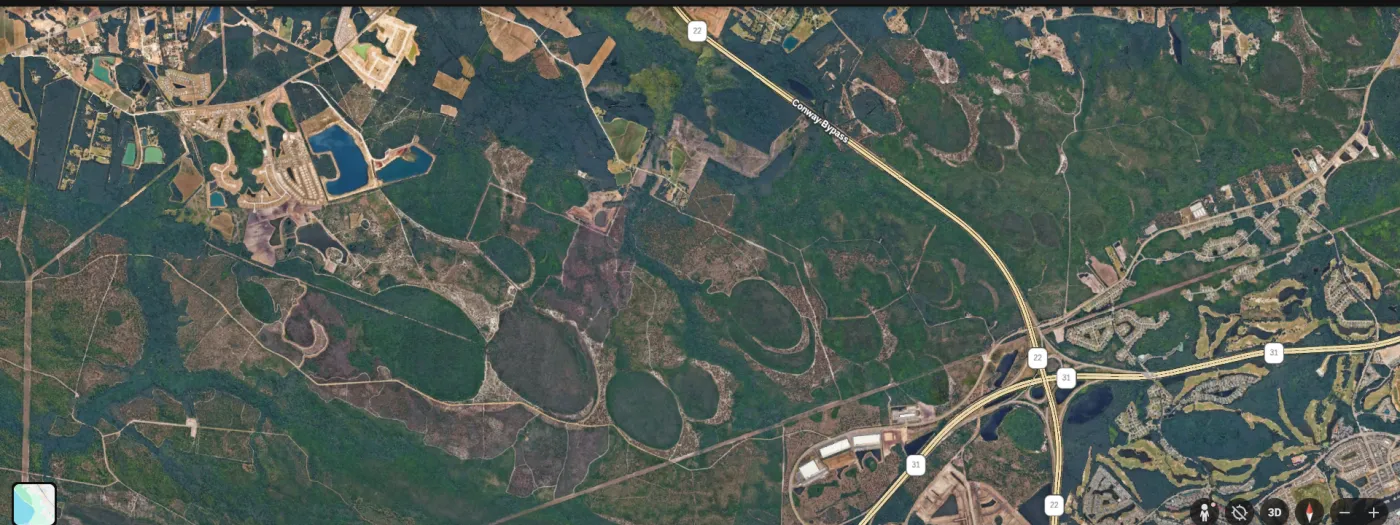
A Google Earth view near the Carolina Bays Parkway, North Myrtle Beach. The ovals are impossible to un-see once you spot them.
Top LiDAR image: USGS 3D Elevation Program · public domain · Google Earth view: user capture
The Proof in Stone
Randall Carlson and the Mega-Floods
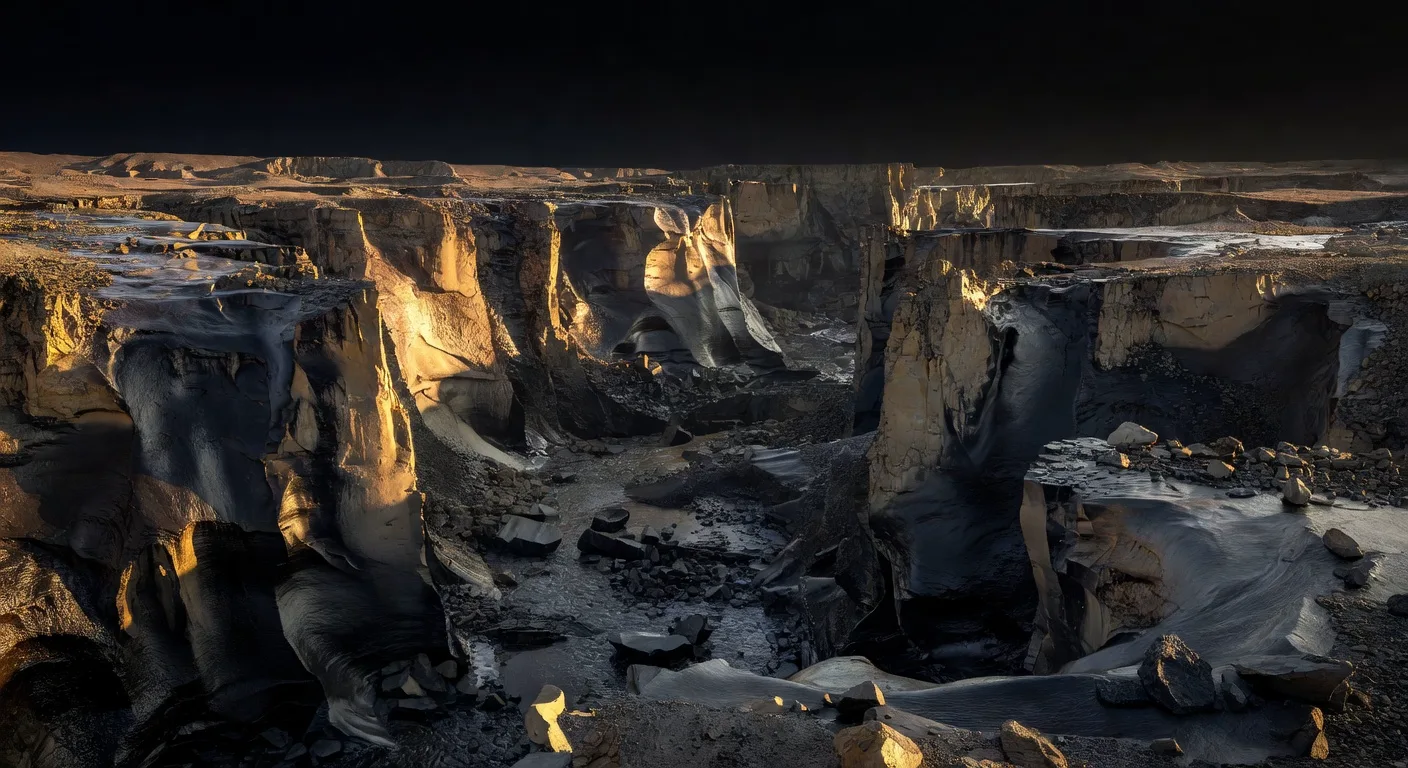
Eastern Washington is cut to the bone by the Channeled Scablands — a landscape carved by water flows that dwarf anything in recorded history. Dry Falls was once a waterfall 3.5 miles wide and 400 feet tall — ten times the width of Niagara — and it now stands dry as a dusty monument to whatever went through it. Giant current ripples thirty feet high, carved directly into basalt bedrock, are visible from space.
For forty years mainstream geology refused to accept a catastrophic explanation. J Harlen Bretz proposed catastrophic flooding in 1923 and was openly ridiculed for a generation. At the time, the only respectable position was that the Earth only changes slowly — never in violent jumps. The field caught up in the 1960s. In 1979, at age 96, Bretz received the Penrose Medal — geology’s highest honour — for the idea that had been heresy in his prime.
Randall Carlson has spent decades documenting the physical evidence: house-sized boulders dumped hundreds of miles from their source, gravel bars the size of city blocks, carved canyons, and radiation-based dates that tie the largest flood events back to the Younger Dryas boundary at 12,900 years ago. The scale is absurd — at peak, the flow reached 17 million cubic metres per second, more water than every river on Earth put together. When the ice dam holding glacial Lake Missoula failed, the lake drained in roughly 48 hours.
The Honest Position
What We Can Say With Certainty
The Younger Dryas happened. The climate flipped back into ice-age conditions inside a single human generation roughly 12,900 years ago, held for about 1,200 years, and then flipped back just as fast. That part is settled — it’s written into ice cores, lake-bottom mud, and the chemistry of ancient shells on every continent. What’s harder to dismiss every year is the convergence: 37 kinds of big animals gone at the same layer in the dirt, half a million oriented depressions pointing at the Great Lakes, giant flood dates in eastern Washington that cluster right on the same boundary.
What is contested is whether these lines connect to a single cause. The Younger Dryas Impact Hypothesis is still a minority position in academia, but the iridium spike, the tiny diamonds, the little glass beads, the big-animal die-off pattern, the Carolina Bays alignment, and the radiation-dated Scablands floods have moved it from fringe to something mainstream journals now feel they have to argue against. Each piece alone can be explained away. Together they make a pattern that needs an answer better than “coincidence.”
Our working position: the physical evidence now crosses the chemistry of the rocks, the fossils of the animals, the shape of the land, and the record of the ancient floods — all of it pointing at the same narrow window in time. The people who built Göbekli Tepe around 9500 BCE were the survivors on the far side of one of the most violent events of the last 50,000 years — and they remembered enough to carve it in stone.
Every culture remembers. Some of them were right.
Ziusudra predates Noah by a thousand years. The Reid-Nunn 2015 paper proved Aboriginal oral memory carries real coastlines from 7,000 years ago. A 2016 Science paper dated the Chinese Gun-Yu flood to a real catastrophic event.
Rabbit hole detected
Deep dive →Sources & Further Reading
- Firestone et al. — "Evidence for an extraterrestrial impact 12,900 years ago" (2007) — the original Younger Dryas Impact Hypothesis paper
- Kjær et al. — "A large impact crater beneath Hiawatha Glacier in northwest Greenland" (2018) — discovery of the 31 km crater under the ice sheet
- Haynes — "Younger Dryas 'black mats' and the Rancholabrean termination" (2008) — documentation of the black mat layer at 50+ sites
- Zamora — "A model for the geomorphology of the Carolina Bays" (2017) — ice-fragment ballistics modeling
- J Harlen Bretz — catastrophic flood hypothesis (1923) — the original Channeled Scablands research
- Randall Carlson — Geocosmic Rex — ongoing field research into catastrophic geology
- Paul Martin — Quaternary overkill hypothesis (1966) — the human-driven megafauna extinction model
Part II — The Monuments That Survived
Impossible Engineering
Kailasa Temple — Carved From the Sky Down
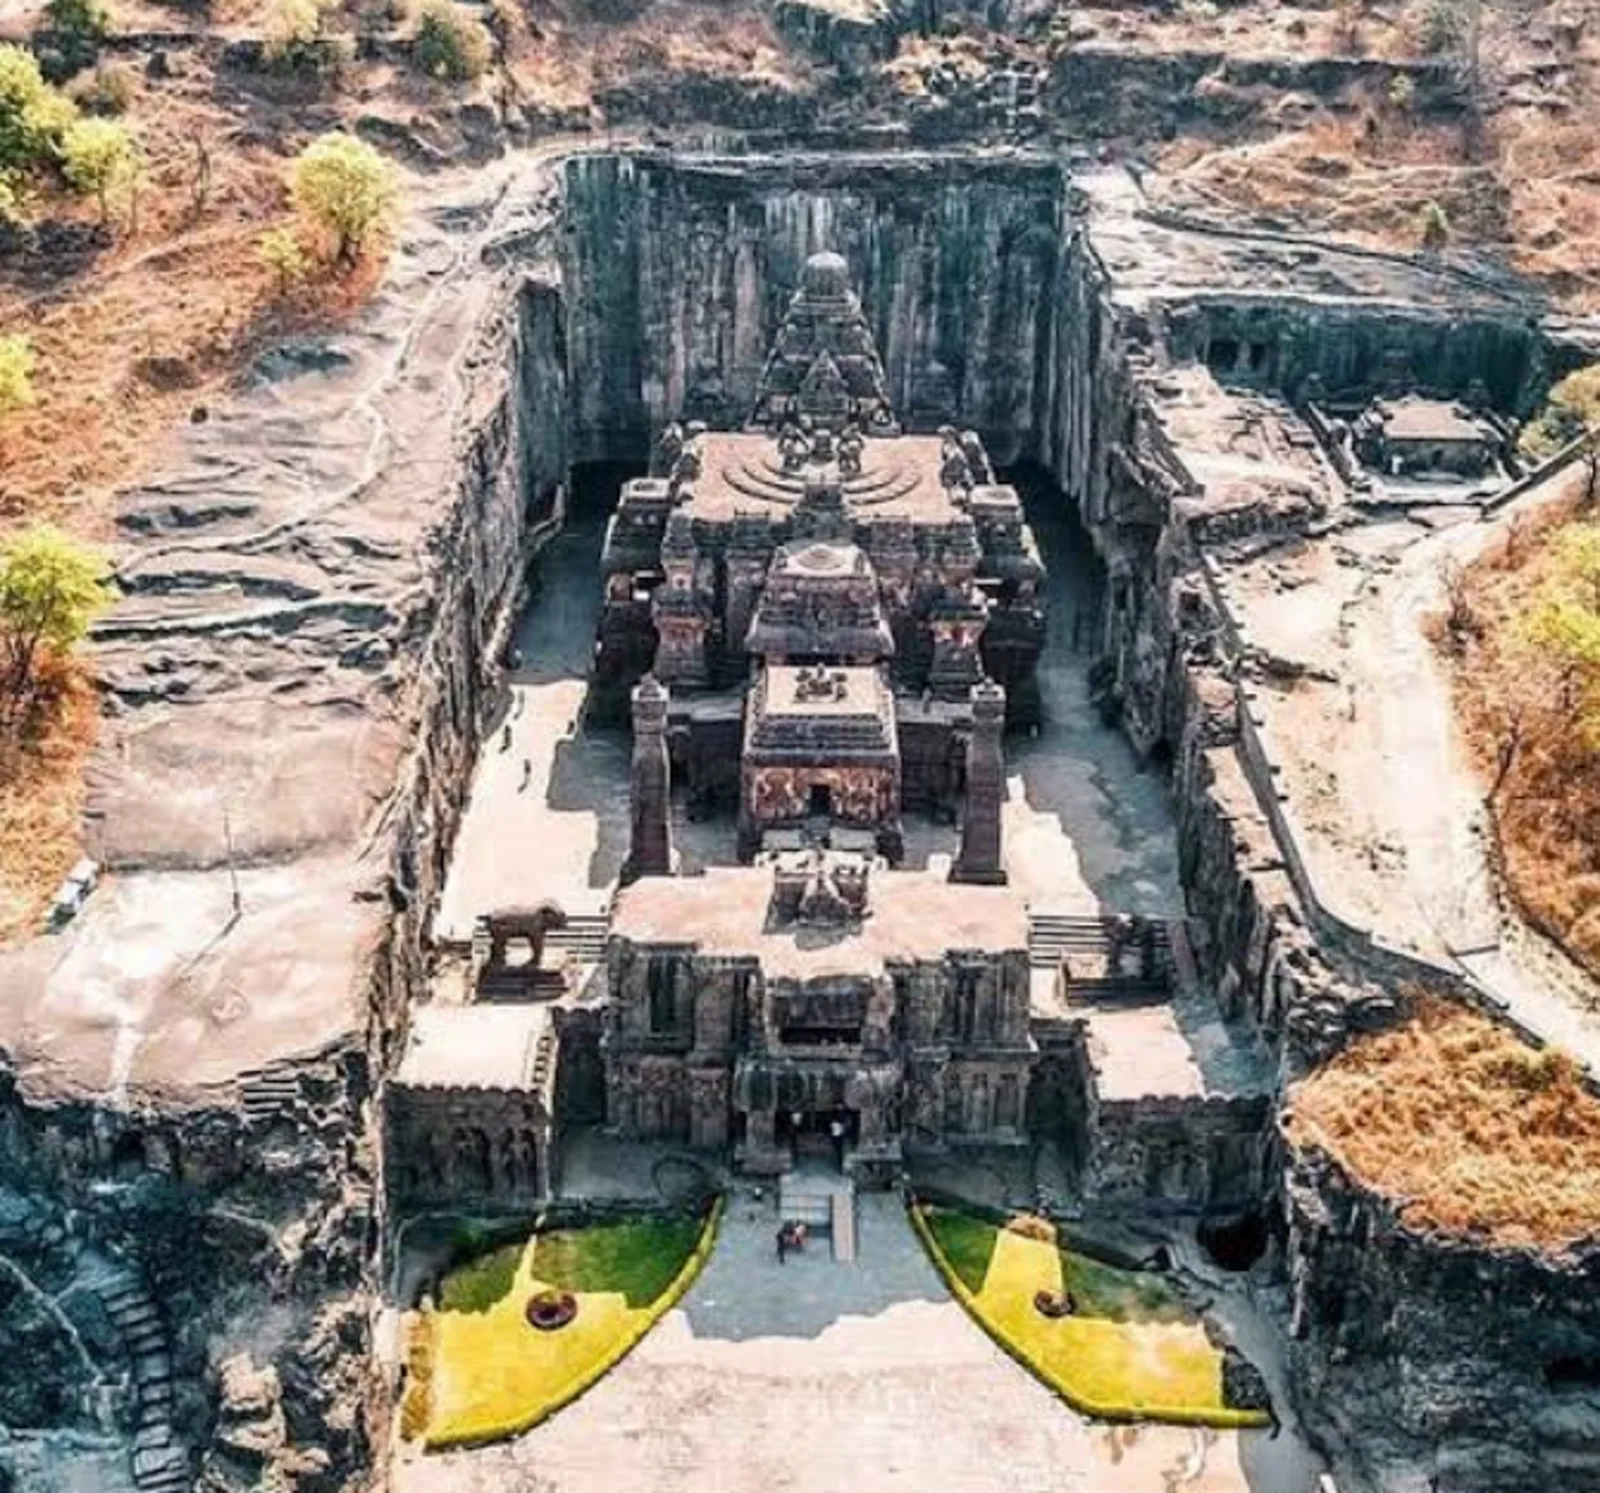
The Kailasa Temple at Ellora (Cave 16) in Maharashtra, India is the largest monolithic rock-cut structure on the planet. It was not built by stacking stones — it was subtracted from a single basalt cliff, top down. An estimated 200,000 to 400,000 tons of rock were removed to reveal the temple hidden inside the mountain. Every carving, column, and staircase you see was already inside the rock. The builders just had to stop cutting at exactly the right place.
Multi-storey halls, drainage channels, bridges between sections, huge elephants on pedestals, layered carvings of Shiva and the gods — all cut with hand tools, in a place where one wrong swing in the wrong direction would have dropped the roof onto the floor below. Mainstream dating puts the work around the eighth century CE under the Rashtrakuta dynasty. The ambition and the precision both hint at either a very long tradition of stone-working behind it, or knowledge inherited from older builders whose names we don’t know.
Like the Great Pyramid and Göbekli Tepe, Kailasa doesn’t fit neatly anywhere on the expected timeline of human progress. Whoever did it knew exactly what they were doing.
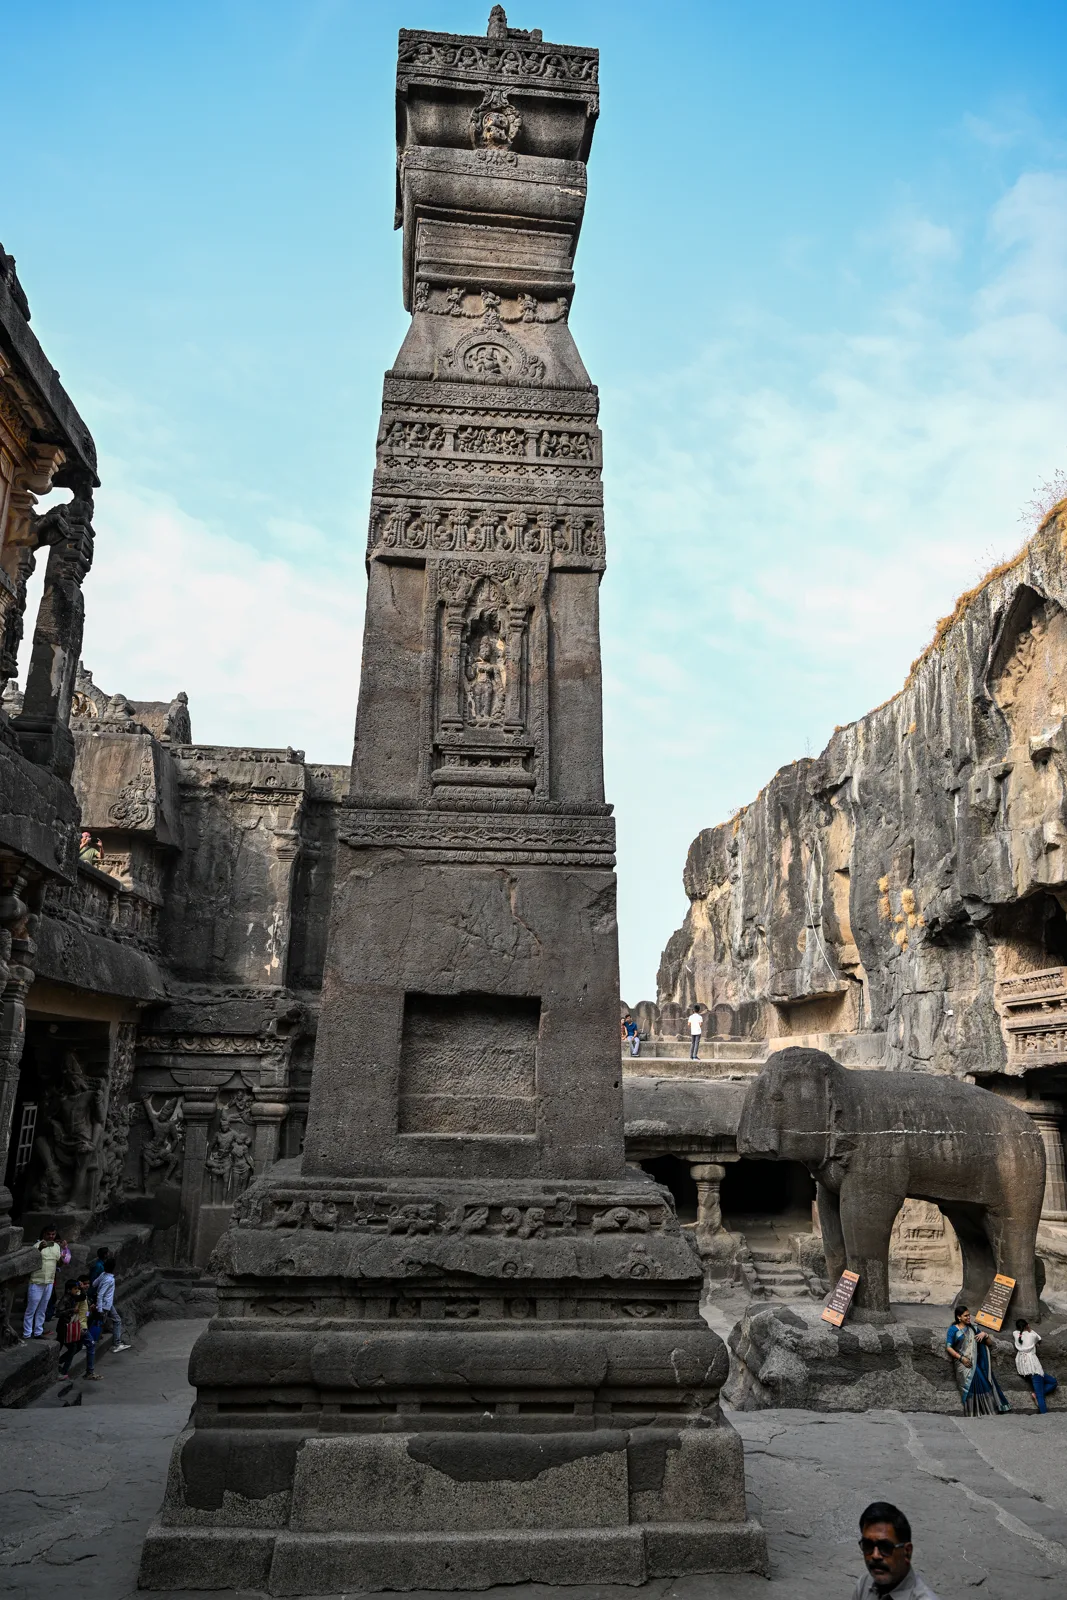
The courtyard: carved pillar, elephant base, cliff walls towering above
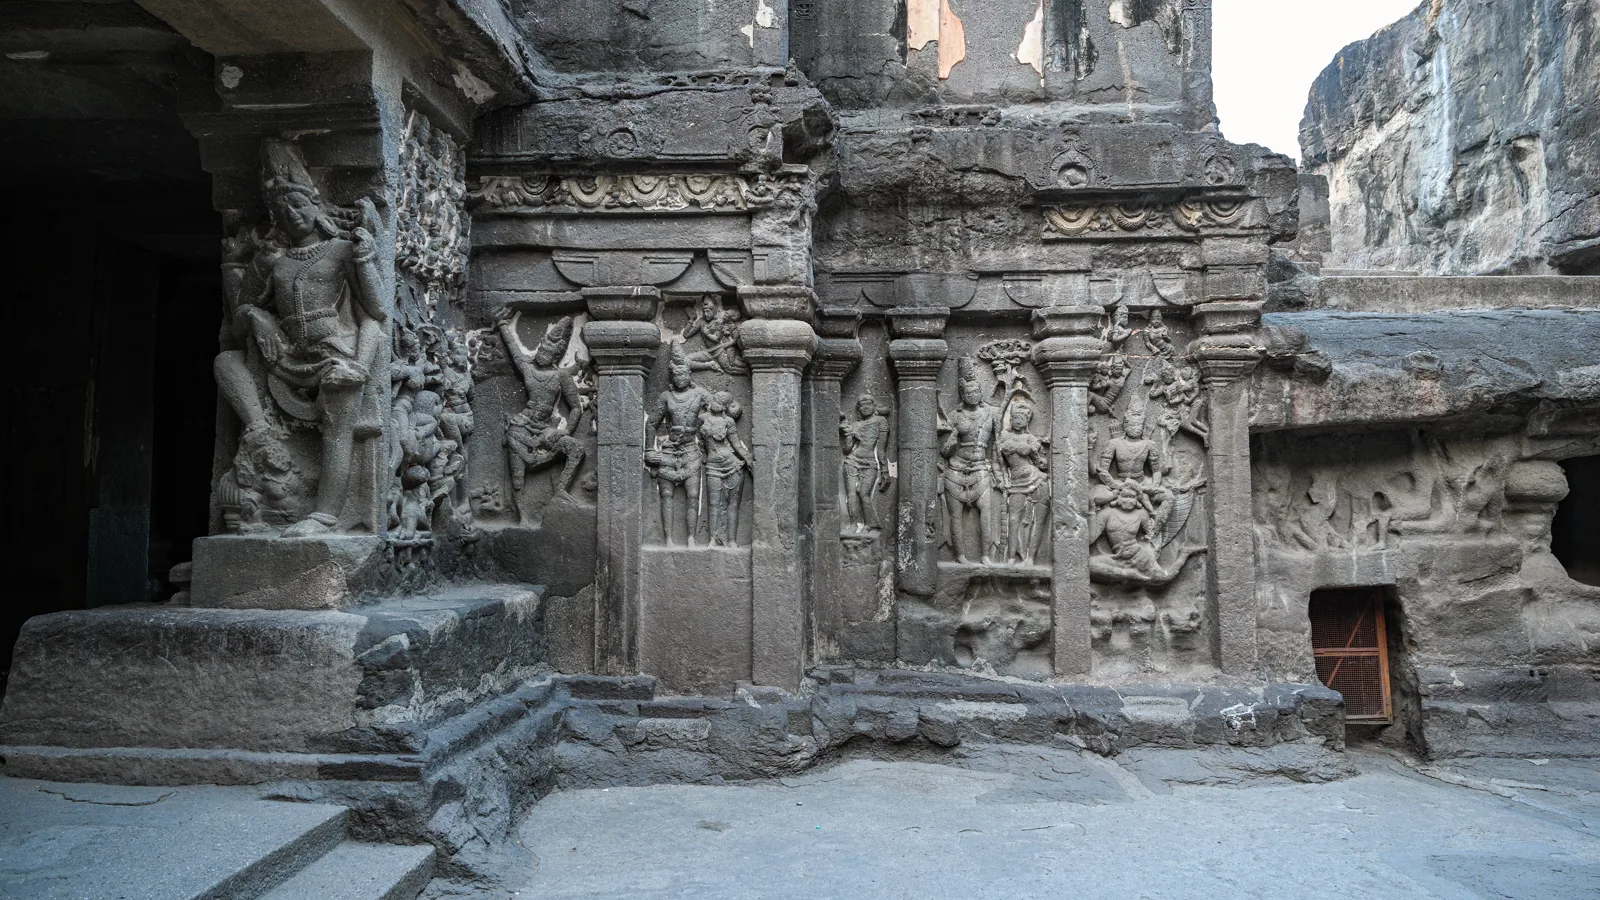
Wall panels: deities, celestial beings, mythological scenes — all from one rock
Aerial: Jawale Kiran · CC BY-SA 4.0 · Detail photos: Anjan Kumar Kundu · CC BY 4.0 · Wikimedia Commons
Same Technique, Different Continent
Lalibela — Ethiopia's Rock-Hewn Churches
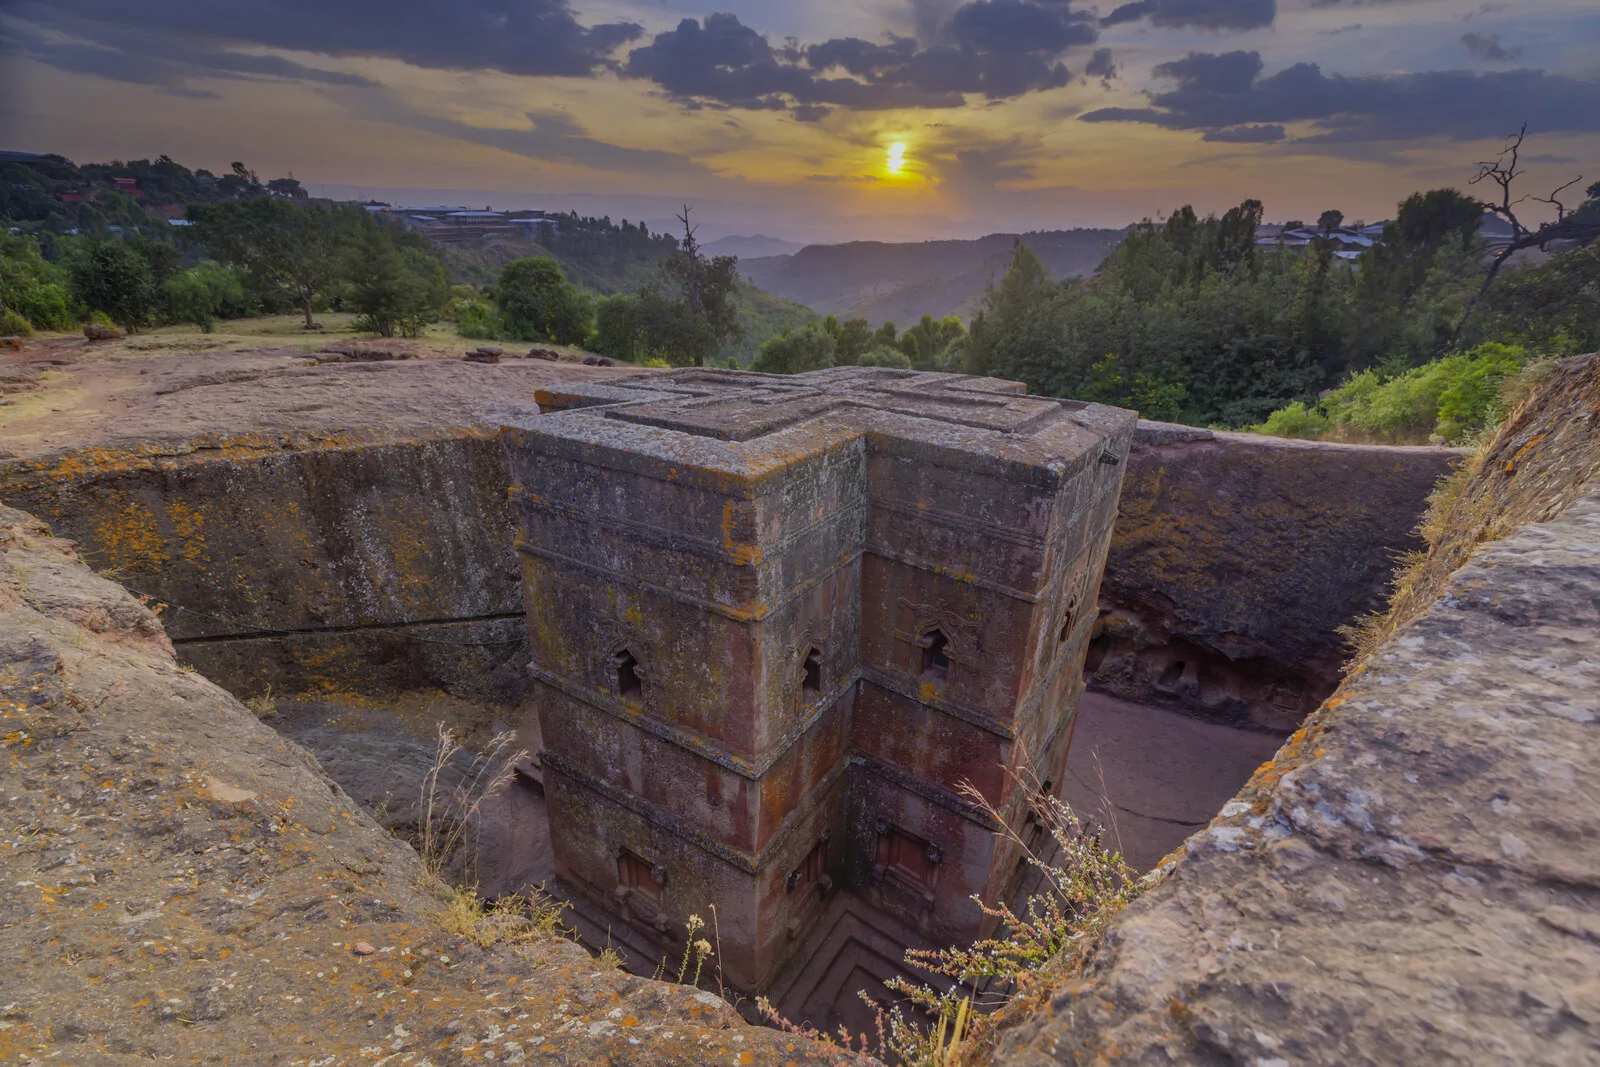
In the Ethiopian highlands, eleven medieval monolithic churches — the rock-hewn churches of Lalibela — were cut directly out of solid volcanic rock using the same top-down subtractive method as Kailasa. Tradition credits King Lalibela in the 12th–13th century CE. The churches are still active sites of Ethiopian Orthodox worship today.
The engineering parallels to Kailasa are hard to ignore: elaborate drainage, precisely cut windows and columns, intricate arches, all carved out of a single continuous stone. The Church of Saint George (Bete Giyorgis) is the most famous — a perfect cross carved forty feet straight down into the earth, so clean it looks stamped.
Two separate cultures on opposite sides of the world, independently, picked the hardest possible way to build — carving by taking away, instead of stacking up — and both produced results that would still give a modern engineering team a hard time. Either a coincidence of ambition, or the trace of a shared stone-working tradition older than either site.
Photo: Thomas Fuhrmann · CC BY-SA 4.0 · Wikimedia Commons
The Sign and the Seal
The Ark of the Covenant — Still in Ethiopia?
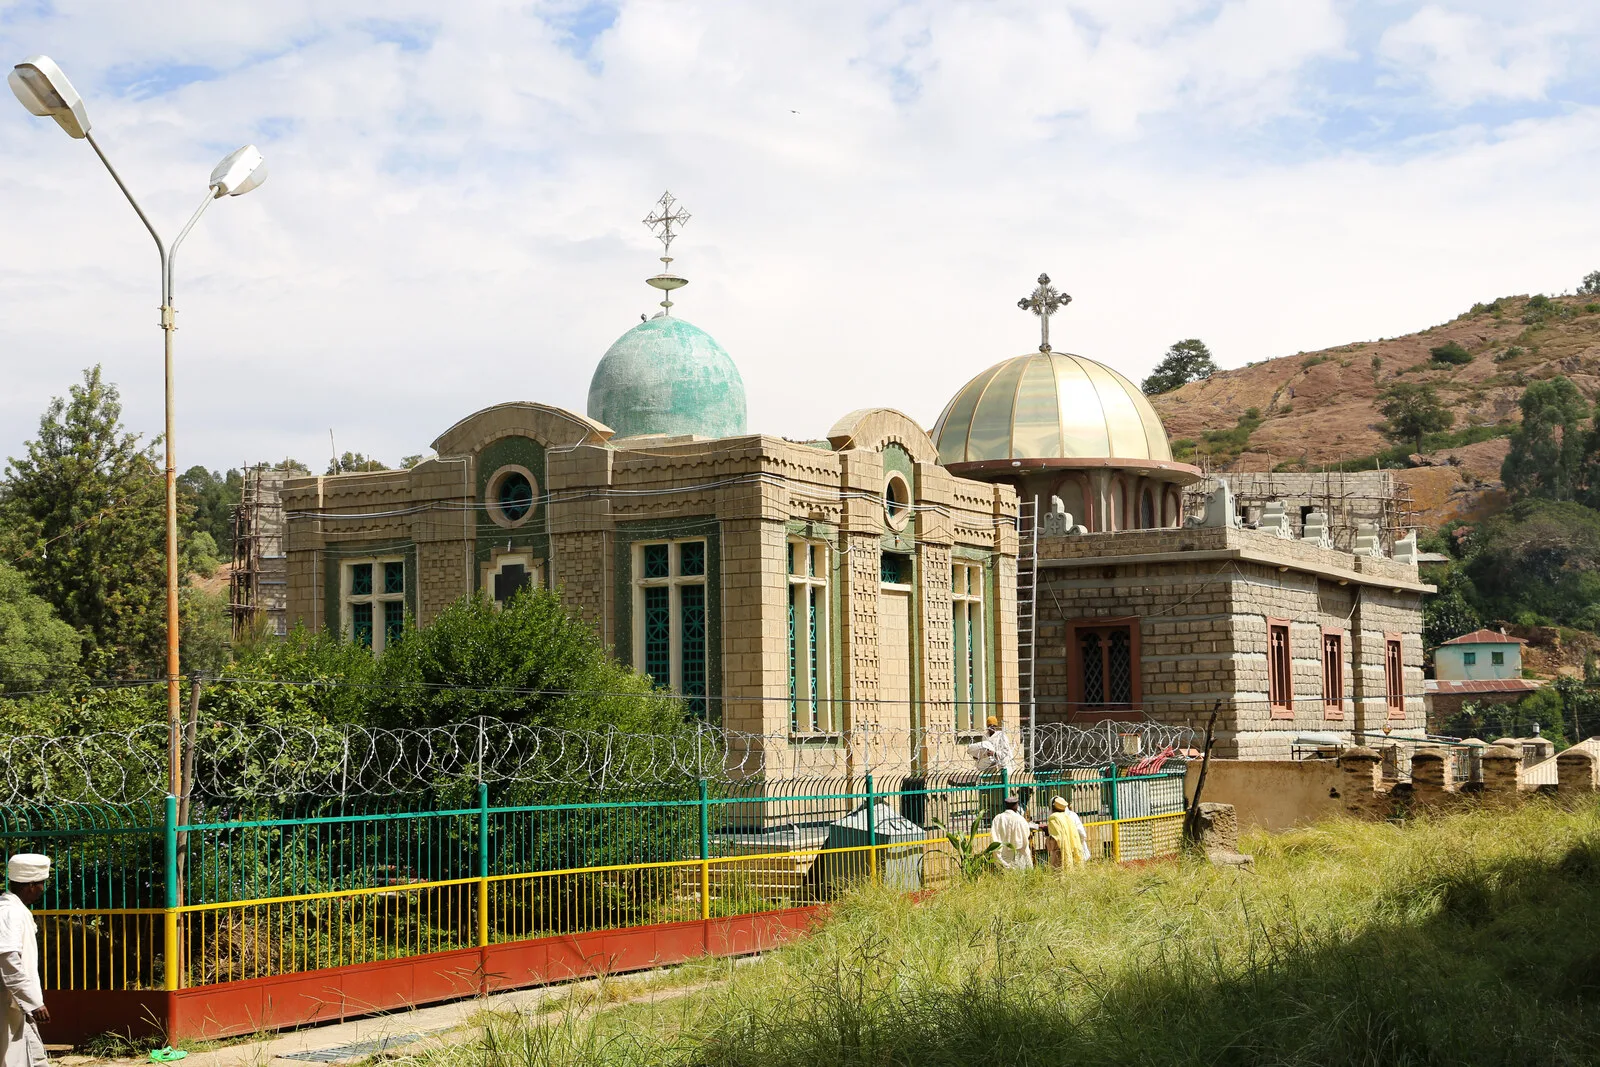
Ethiopia’s connection to the ancient world goes deeper than rock churches. According to the Kebra Nagast (“Glory of Kings”), the Ark of the Covenant was brought to Ethiopia by Menelik I, son of King Solomon and the Queen of Sheba. The Ethiopian Orthodox Church has held that claim for something close to seven hundred years.
The Ark is said to rest in the Chapel of the Tablet at the Church of Our Lady Mary of Zion in Axum. One guardian monk is appointed for life; no one else, including the Patriarch of the Ethiopian Church, is permitted to see it. Graham Hancock investigated this for years in The Sign and the Seal (1992) and found the chain of tradition surprisingly coherent.
Hancock also reported that the guardian monks suffer medical problems suggestive of radiation exposure — cataracts and shortened lifespans, with some dying within a few years of appointment. That claim comes from his investigation and is not independently verified. It sits uncomfortably next to the biblical descriptions of the Ark as dangerous to touch and fatal to look into.
When Jerusalem fell to the Babylonians in 586 BCE, the Ark vanished from the historical record. Ethiopian tradition says it was already out of Jerusalem by then, carried south centuries before. The long-standing Jewish community in Ethiopia (Beta Israel) and the deep Old Testament bones of Ethiopian Christianity make a Jerusalem–Egypt–Nile transmission corridor physically plausible, even if the specific story remains unproven.
Photo: Sailko · CC BY 3.0 · Wikimedia Commons
Sources & Further Reading
- Kailasa Temple, Ellora — Wikipedia — overview of the world's largest monolithic rock-cut structure
- Rock-Hewn Churches of Lalibela — Wikipedia — Ethiopia's 11 monolithic churches
- Kebra Nagast (Glory of Kings) — the Ethiopian royal chronicle connecting Solomon, Sheba, and the Ark
- Graham Hancock — "The Sign and the Seal" (1992) — investigation into the Ark of the Covenant in Ethiopia
Part III — The Pulse of the Planet
Live Data
Key Metrics
Magnetic Shield
29.5 µT
-9% in 200 years
Magnetic Pole Drift
~35 km/yr
Slowing from 55 peak
Schumann Resonance
7.83 Hz
Earth's heartbeat
Earthquakes M4.5+
197
This week · 9 major
Active Volcanoes
~45
Erupting now worldwide
S. Atlantic Anomaly
Growing
Weakest shield region
Near-Earth Objects
39
Tracked this week
Updated October 26, 2026
Geomagnetic Shifts
The Magnetic Field
Earth’s magnetic shield — the thing that blocks cosmic rays and helps hold our atmosphere in place — is getting weaker. Magnetic north is sprinting. And a growing weak spot in the field is spreading over the South Atlantic.
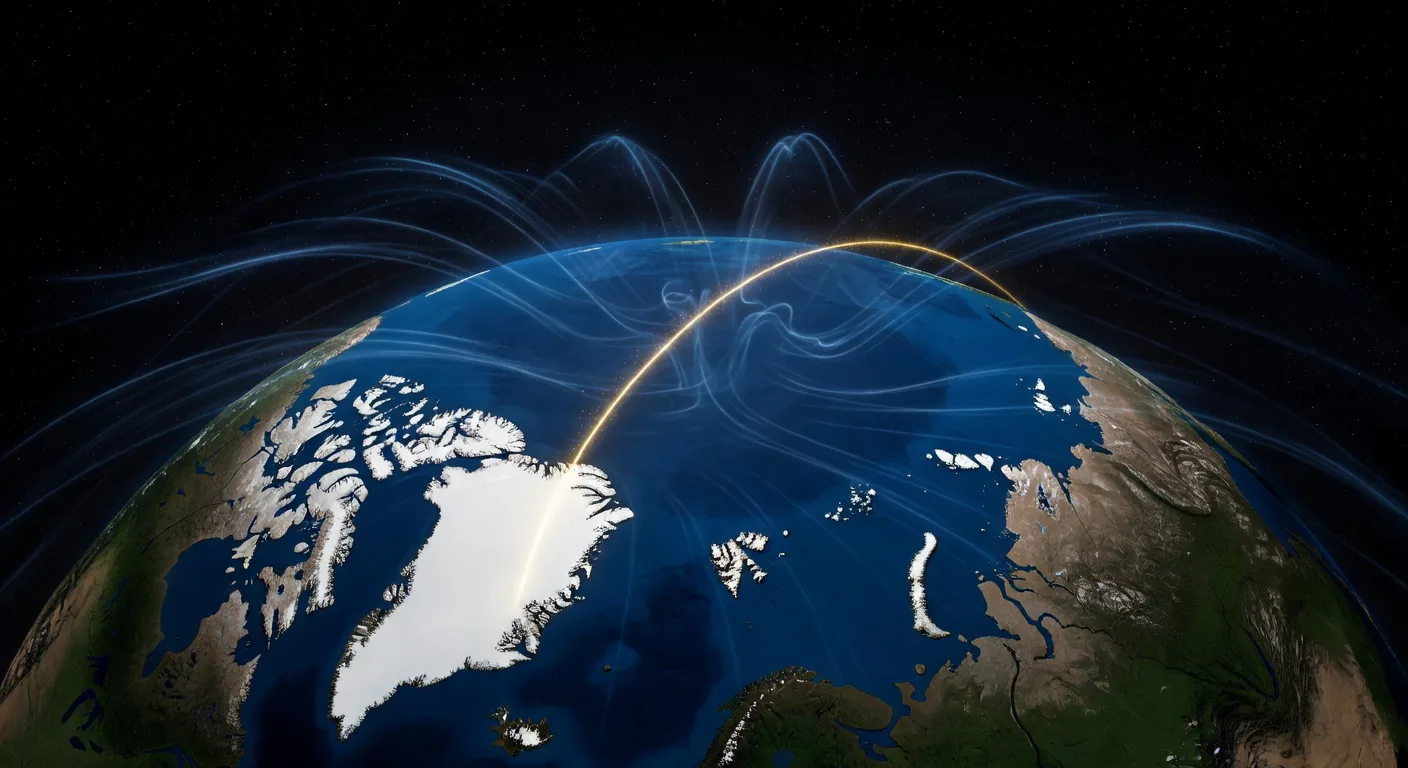
Pole Drift & Field Weakening
Earth’s magnetic field has lost roughly 9% of its strength over the past 200 years. The magnetic north pole, which barely moved before 1990, is now sprinting from Canada toward Siberia at around 55 km per year — fast enough that aviation navigation charts have to be redrawn on an unscheduled cycle. Over the South Atlantic, a growing weak spot has the shield already dangerously thin, exposing satellites to elevated radiation as they fly through.
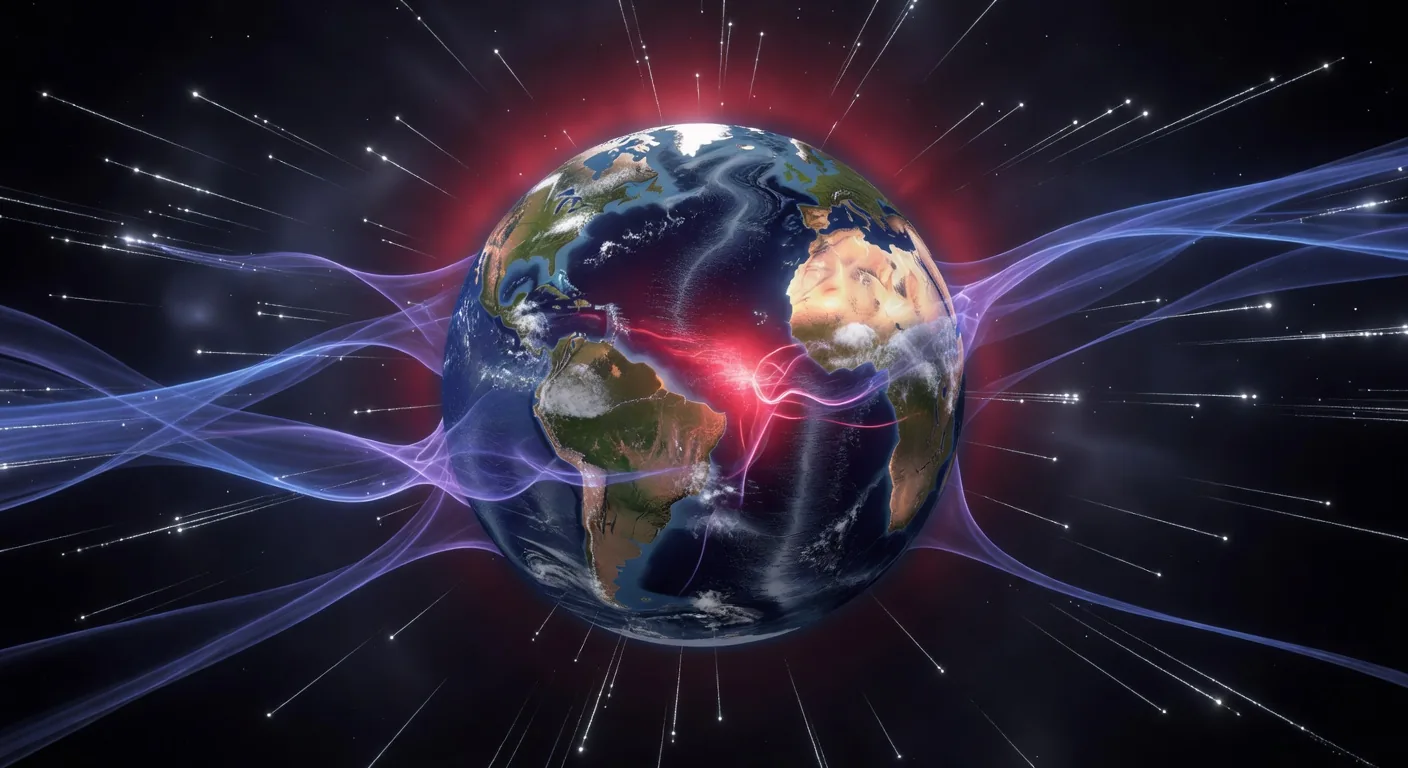
Excursions & Reversals
Some researchers read the current weakening as the early stage of a geomagnetic excursion — a partial wobble — or possibly a full reversal (north and south poles swapping). The last complete flip was the Brunhes–Matuyama reversal, about 780,000 years ago. Partial wobbles are more common; the Laschamp event only 41,000 years ago saw the field collapse to about 5% of its normal strength for a few centuries. That’s not the end of the world — the fossil record shows life got through it — but it’s a real planetary event, and it’s on the calendar of things that happen.
7.83 Hz
Schumann Resonance
A constant electromagnetic hum in the space between Earth’s surface and the upper atmosphere. Predicted in 1952, measured in 1954, and still doing things nobody has fully accounted for.
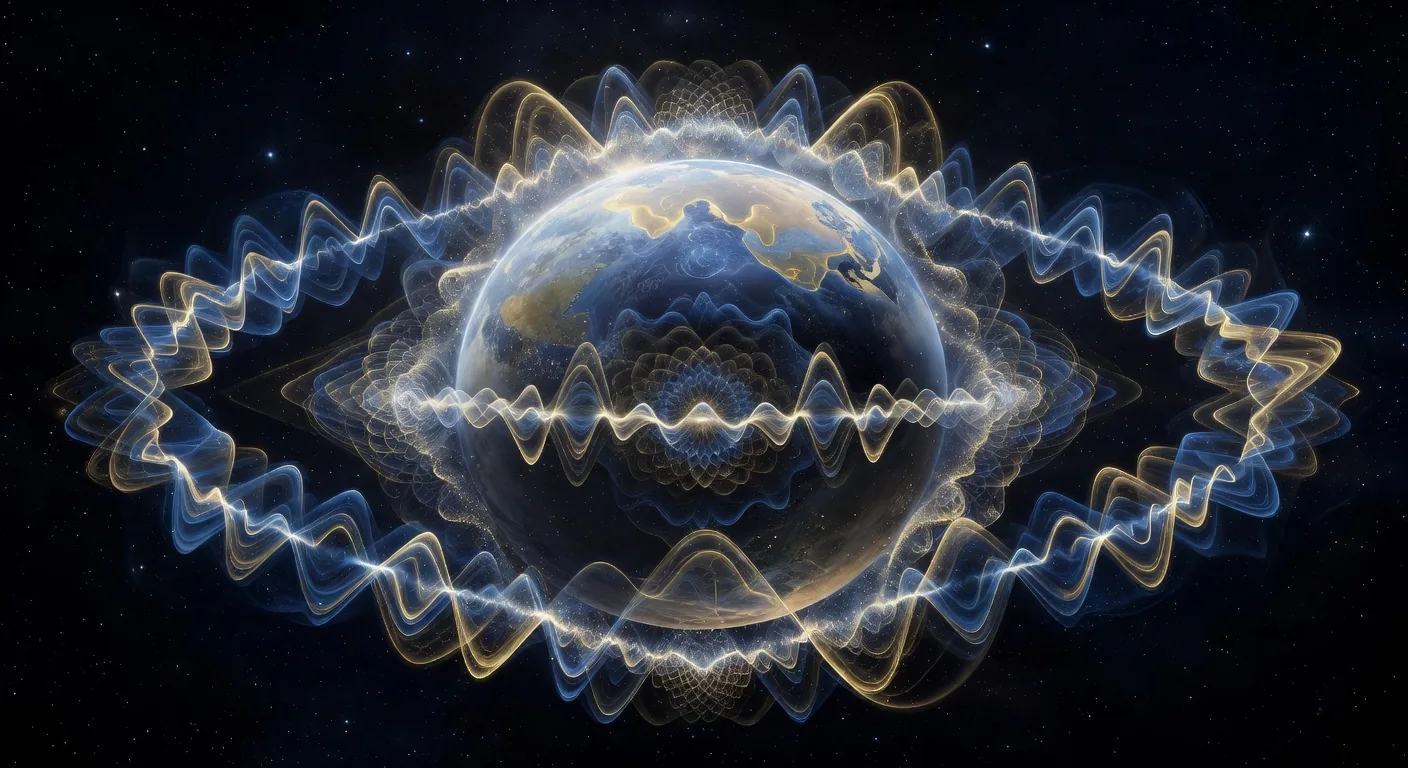
Earth’s Electromagnetic Heartbeat
The Schumann resonance is the base note of a huge natural drum about 8,000 kilometres across — the space between Earth’s surface and the electrically charged layer of the upper atmosphere. Lightning strikes hit this drum constantly, and the result is a steady hum with clear peaks at 7.83, 14.3, 20.8, 27.3 and 33.8 Hz. Winfried Schumann worked out the math in 1952. Balser and Wagner caught it on instruments at Lincoln Lab two years later.
Global thunderstorm activity — roughly 50 lightning strikes per second, worldwide, non-stop — keeps the drum ringing. The 7.83 Hz wave circles the Earth many times before it fades. The ceiling of the drum (the upper atmosphere) moves with solar activity, and the shape flexes with the weather, so the frequency wobbles a bit around that number. 7.83 is the long-term average, not a constant.
The Alpha-Theta Boundary
Why Brains Might Listen
The human brain produces EEG activity in distinct bands: delta (0.5–4 Hz, deep sleep), theta (4–8 Hz, meditation and REM), alpha (8–13 Hz, relaxed awareness), beta (13–30 Hz, normal alert cognition), gamma (30+ Hz, peak focus). The Schumann fundamental at 7.83 Hz sits exactly on the boundary between theta and alpha — the frequency range associated with meditation, light trance, and flow-state creativity.
Whether that overlap means anything or is just a coincidence is an open question. Michael Persinger and Herbert König argued that human brains may be tuned to the Schumann frequency because we evolved inside its constant hum. The counterargument: brains run at those frequencies for their own reasons, and the match is just numbers lining up. What’s not in dispute: that frequency range matters for human consciousness — and the planet is broadcasting at it, continuously, whether we’re listening or not.
Post-2020 Anomalies
The Spikes Nobody Expected
The Tomsk and Cumiana monitoring stations publish continuous Schumann data. Since early 2020 there have been repeated amplitude spikes in the fundamental and its harmonics, well above the historical baseline. The resonance has always varied — daily, seasonally, with the solar cycle — but the recent excursions are large enough to stand out against the noise.
The mainstream read: natural variability plus selective attention. The fringe read: the ionosphere itself is changing — Solar Cycle 25 ran hotter than forecast, the geomagnetic field is weakening, and the cavity’s upper boundary is being pushed around harder than usual. Both readings are physically plausible. Nobody has cleanly ruled out either.
Seismic Coupling
Does the Resonance Know About Earthquakes?
A small but persistent research program has tracked correlations between Schumann power spikes and major seismic events. The mechanism, if real: pre-earthquake stress in the crust produces electromagnetic signals strong enough to perturb the ionosphere, which in turn briefly shifts the Schumann cavity. Masashi Hayakawa (Japan), Dimitar Ouzounov (NASA), and the Russian Academy of Sciences IZMIRAN group have published cases where Schumann anomalies preceded M6+ earthquakes by hours to days.
The effect size is small, the statistics are contested, and the false-positive rate is real. Nobody in mainstream earthquake research treats Schumann monitoring as a reliable early warning today. But it’s also one of the few candidate signals that has survived two decades of scrutiny without being completely killed off. The file stays open.
Seismic & Volcanic
Earthquakes & Volcanoes
Recent Earthquakes (M4.5+)
45 km NNW of Ende, Indonesia
1 hours ago · 10 km depth
182 km NW of Port-Olry, Vanuatu
1 hours ago · 10 km depth
41 km WNW of Kupang, Indonesia
2 hours ago · 35 km depth
205 km NW of Port-Olry, Vanuatu
4 hours ago · 10 km depth
Bonin Islands, Japan region
7 hours ago · 482 km depth
Source: USGS · Updated October 26, 2026
Volcanic Activity
Supervolcanoes
Yellowstone Caldera
Last major eruption 640,000 years ago. The magma chamber underneath holds enough material to blanket most of North America in ash. “Overdue” is the wrong word — supervolcano timing is not a schedule — but it is not dormant. More than a thousand earthquakes are recorded in the caldera every year.
Campi Flegrei — Italy
Europe's Supervolcano
The ground beneath Naples has risen more than a metre since 2005. Bradyseism — slow volcanic uplift — is accelerating. Over 40,000 earthquakes recorded since 2023. Three million people live inside the caldera.
The Ring of Fire
~45 Volcanoes Erupting Right Now
Roughly 75% of all active volcanoes sit on the Ring of Fire — a 40,000 km horseshoe of subduction zones around the Pacific. Indonesia alone hosts 130 active volcanoes. Tectonic plates don’t argue with each other slowly; when they move, everything on top of them moves with them.
What History Shows
Volcanic Winter
The 1815 eruption of Tambora caused the “Year Without a Summer”: global crop failures and famine across Europe, North America, and Asia. The Toba eruption 74,000 years ago may have cut the human population to a tiny fraction of what it was — though the “genetic bottleneck” reading (the idea that everyone alive today descends from a few thousand survivors) is now contested on the basis of newer DNA evidence. Either way, supervolcanoes don’t announce themselves before they go.
Source: Smithsonian Global Volcanism Program (opens in new tab)
Sources & Further Reading
- Schumann Resonances — Wikipedia — overview of the Earth-ionosphere electromagnetic cavity
- Tomsk State University — Schumann Resonance Monitoring — live Schumann resonance data from Tomsk, Russia
- Michael Persinger — neuroscience researcher on geomagnetic effects on the brain
- Brunhes–Matuyama Reversal — Wikipedia — the last full geomagnetic reversal ~780,000 years ago
- Laschamp Event — Wikipedia — geomagnetic excursion ~41,000 years ago
- Campi Flegrei (Phlegraean Fields) — Wikipedia — Europe's supervolcanic caldera beneath Naples
- Toba Catastrophe Theory — Wikipedia — the Toba supereruption and contested bottleneck hypothesis
- USGS Earthquake Hazards Program — Real-Time Feeds — live earthquake data
- Smithsonian Global Volcanism Program — worldwide volcanic activity tracking
Part IV — The Human Pulse
The geophysical pulse runs underneath. The human pulse runs on top. The numbers below aren’t here to alarm you — they’re here to put the moment in context. The ancient cataclysm wasn’t a one-off event 12,900 years ago. The cycles run, and humans are part of the system.
Verified Events
Global Conflict Pulse
Ground-truth conflict data from ACLED — verified political violence events and fatalities, country by country, updated monthly.
Events
20,993
September 2026
Fatalities
16,076
September 2026
YoY Events
+18.2%
vs same month 2025
YoY Fatalities
-9.8%
vs same month 2025
Source: ACLED · Updated Oct 22, 2026
90-Day Trend
Conflict Hotspots
Countries with the highest verified fatality counts over the last 90 days. Sparklines show the 12-month fatality trend for each.
Ukraine
EuropeYemen
MENANigeria
AfricaBrazil
AmericasSudan
AfricaPakistan
AsiaMyanmar
AsiaMali
AfricaEthiopia
AfricaMexico
AmericasSource: ACLED · Updated Oct 22, 2026
Early Warning
Escalation Radar
Countries where last month’s fatalities jumped significantly above the prior three-month average — potential escalation signals worth watching.
Yemen
MENA
Last month: 3312 fatalities
3-month avg: 401.3
Chad
Africa
Last month: 50 fatalities
3-month avg: 23.7
Honduras
Americas
Last month: 94 fatalities
3-month avg: 55.7
Jamaica
Americas
Last month: 29 fatalities
3-month avg: 17.7
Source: ACLED · Updated Oct 22, 2026
Regional View
90-Day Regional Breakdown
Where the violence is concentrated right now. Total fatalities by region over the last 90 days.
Africa
39 countries activeEurope
30 countries activeAmericas
26 countries activeMENA
16 countries activeAsia
19 countries activeSource: ACLED · Updated Oct 22, 2026
Long Arc
Fatalities by Year
Global political violence fatalities, 2015 to present. The long arc of modern conflict.
Hover bars for values. 2026 is partial (year-to-date).
Geopolitical instability does not happen in a vacuum. The ancient cycles this site documents — precessional ages, catastrophe memories, collapse patterns — keep playing out at human scale.
Source: ACLED · Updated Oct 22, 2026
Conflict Tracker
Displacement Crises
Countries generating the most displacement in the world right now. Data from UNHCR Global Refugee Statistics, updated annually.
Major Crises
17
Countries with 1M+ displaced
Crisis Zones
40
Countries with 100K+ displaced
Displaced People
107M
Refugees, IDPs & asylum seekers
Sudan
Severe CrisisTotal displaced: 13.7M
Refugees: 2.1M
Internally displaced: 11.6M
Syrian Arab Rep.
Severe CrisisTotal displaced: 13.4M
Refugees: 6.0M
Internally displaced: 7.4M
Afghanistan
Severe CrisisTotal displaced: 9.0M
Refugees: 5.8M
Internally displaced: 3.2M
Ukraine
Severe CrisisTotal displaced: 8.8M
Refugees: 5.1M
Internally displaced: 3.7M
Dem. Rep. of the Congo
Severe CrisisTotal displaced: 8.0M
Refugees: 1.1M
Internally displaced: 6.9M
Colombia
Severe CrisisTotal displaced: 7.1M
Refugees: 0.1M
Internally displaced: 7.0M
Yemen
Major CrisisTotal displaced: 4.8M
Refugees: 0.1M
Internally displaced: 4.8M
Myanmar
Major CrisisTotal displaced: 4.8M
Refugees: 1.3M
Internally displaced: 3.5M
Somalia
Major CrisisTotal displaced: 4.8M
Refugees: 0.9M
Internally displaced: 3.9M
Nigeria
Major CrisisTotal displaced: 3.9M
Refugees: 0.5M
Internally displaced: 3.4M
Source: UNHCR 2024 · Ranked by total displacement
The Earth is a dynamic system
Magnetic field, tectonic plates, atmospheric hum, human conflict — all linked, all moving, all the time. The ancients built their monuments where these forces meet. We’re only now catching up to what they were tracking.
Göbekli Tepe, the Great Pyramid, Newgrange, Angkor Wat — every one of them lined up with celestial and magnetic events the builders should not, by the standard timeline, have been able to measure. The cycles those monuments were tuned to are still turning today.